Microsoft Sentinel Log Usage

Recently I had a customer, well more than one, that wanted to understand the usage and cost of their ingestion of log data into Sentinel. First, the ingestion cost for Sentinel can be confusing because you also pay for ingestion into Log Analytics. I am hoping this will be made more evident in the future for each data connector. Second, some data is free for ingestion. For example, Azure Activity Logs, Microsoft Defender Alerts, and Office 365 Audit Logs can all be ingested for free. These are free for Sentinel and Log Analytics.
I use two ways to see the ingestion usage of my logs in Sentinel, workbooks and KQL. Let us start with the Sentinel Workbook approach first. I will be using Microsoft Sentinel Community-created workbooks, Azure Sentinel Cost, and Workspace Usage Report.
The first step is adding these workbooks to your workspace.
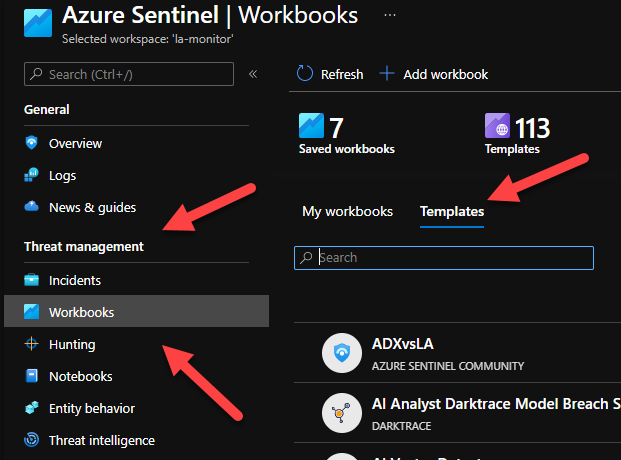
1) Threat management > Workbooks > Templates
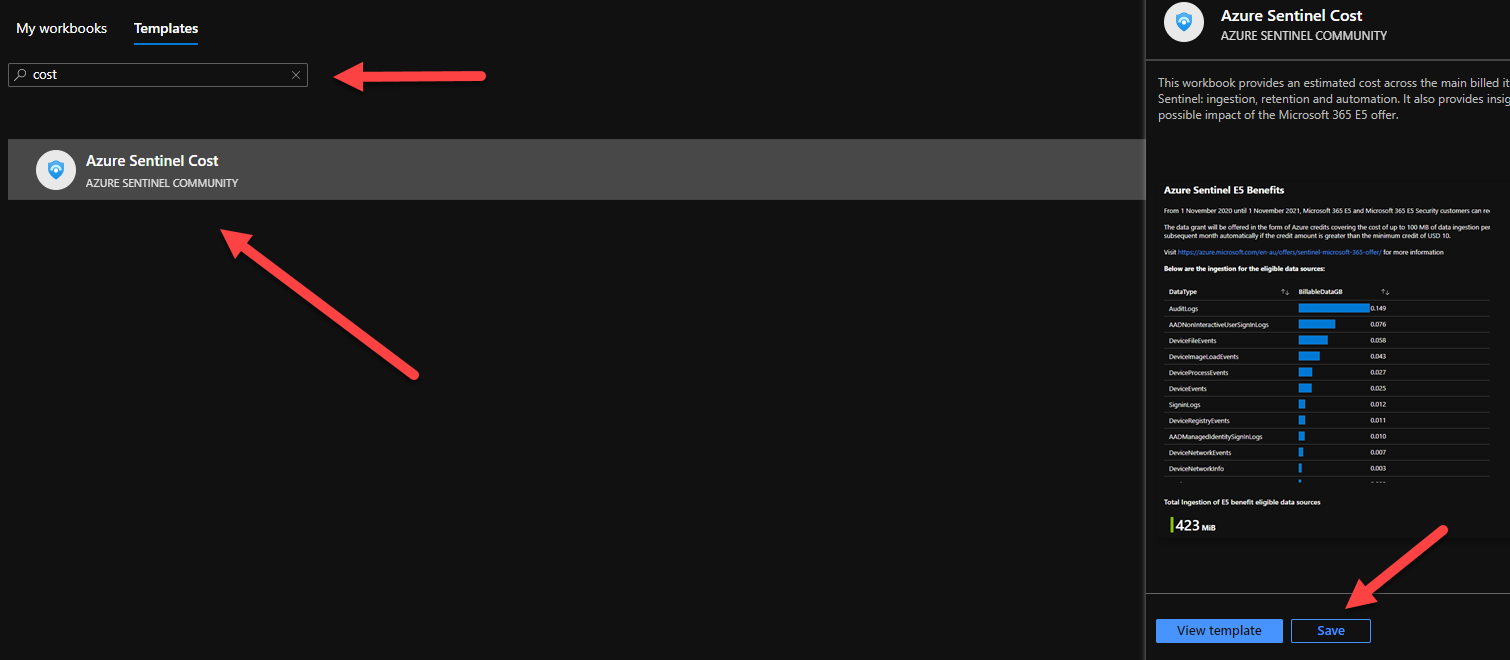
2) Search for Cost and then search Usage
3) Select the template and click Save
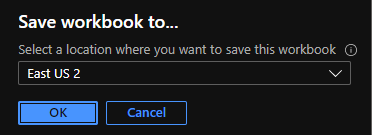
4) Choose a location and click OK
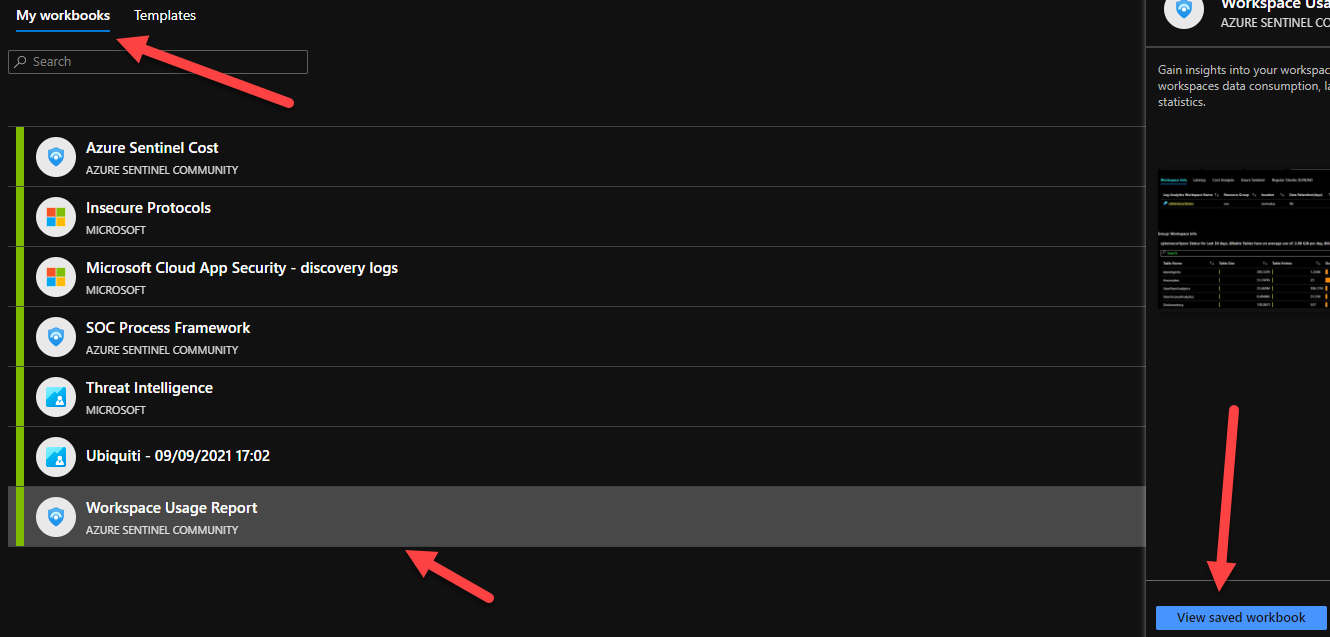
Once you have saved both of these workbooks, you can select My Workbooks to see the workbooks you now have in your workspace.
The first workbook we are going to look at is Workbook Usage Report.
1) Select the Workbook Usage Report and click View saved workbook
2) Set your Workspace and/or TimeRange
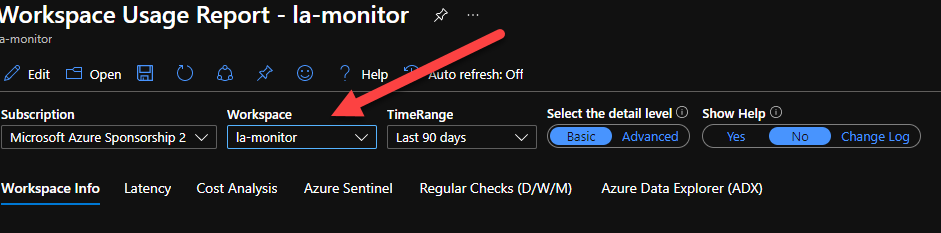
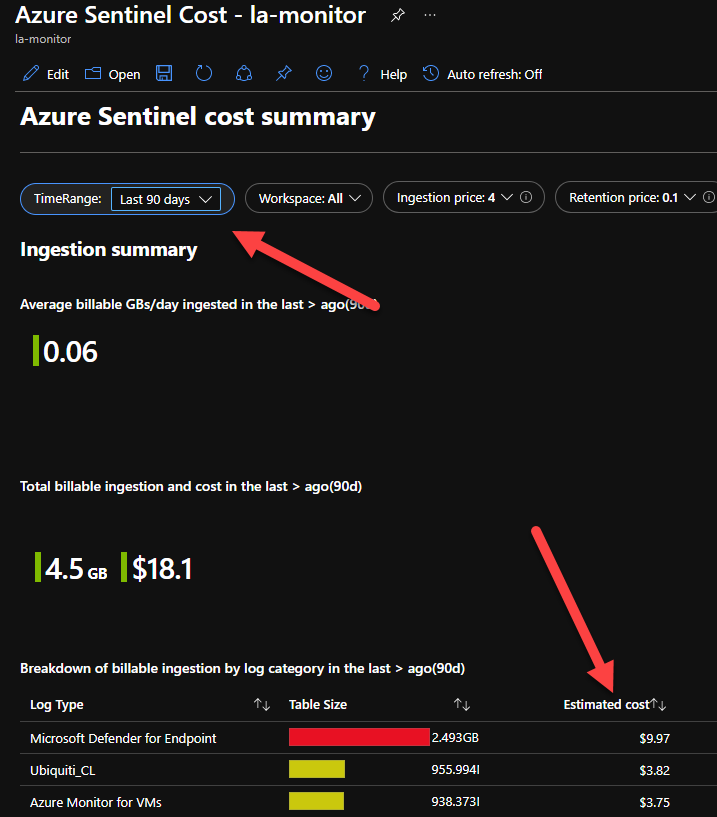
A great place to start playing with this workbook is the Workspace info. You can see the table size and if that table is billable. Take the same steps to exam the Azure Sentinel Cost to get a similar view, with some cost associated.
Now that you have seen the pretty picture way of getting the usage data, let us take a look at using KQL (Kusto Query Language) to examine the data. The following queries come straight from the Microsoft document website and will allow you to pull the same information.
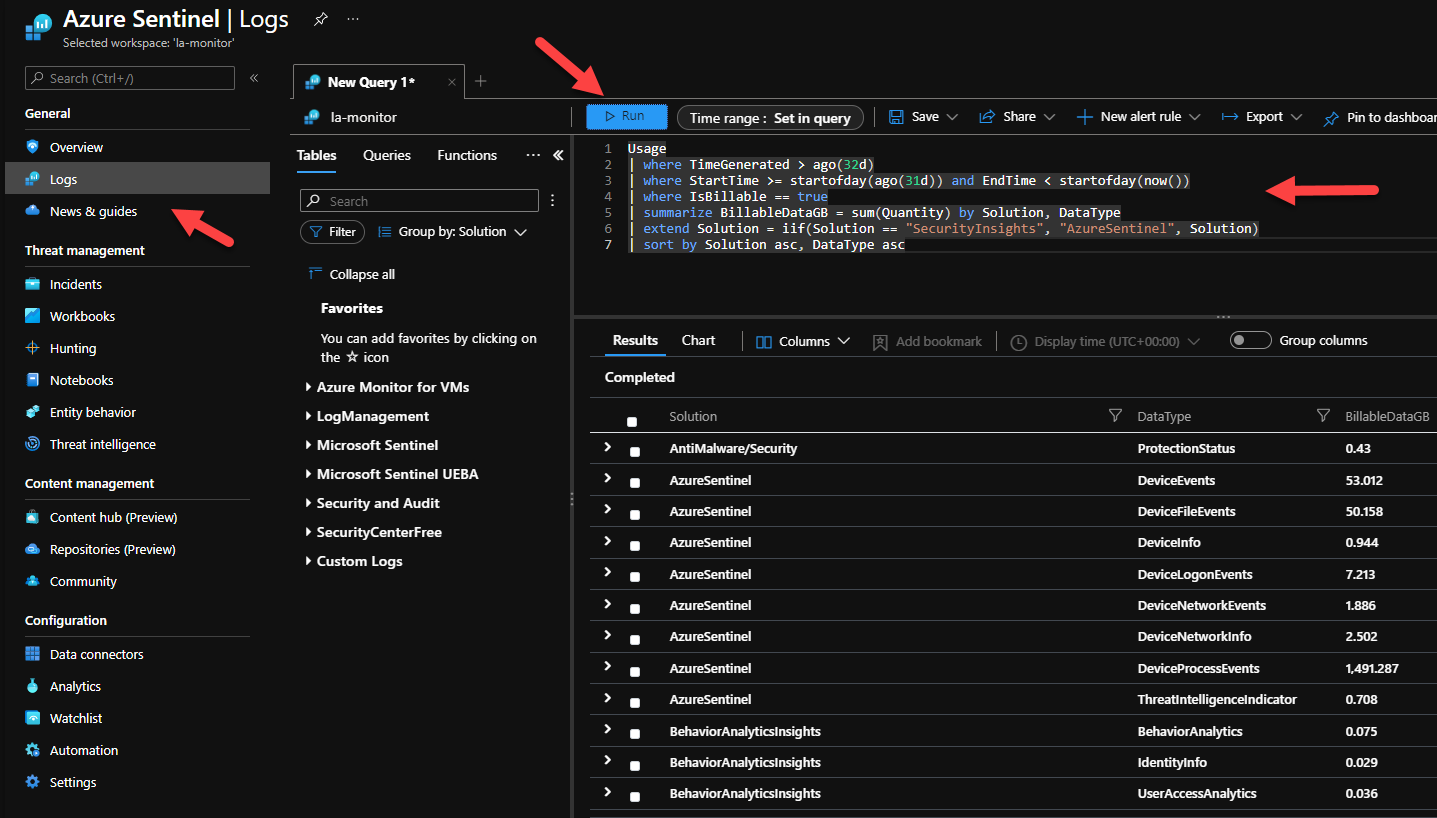
1) Click Logs
2) Copy the code into the query cell
3) Click Run
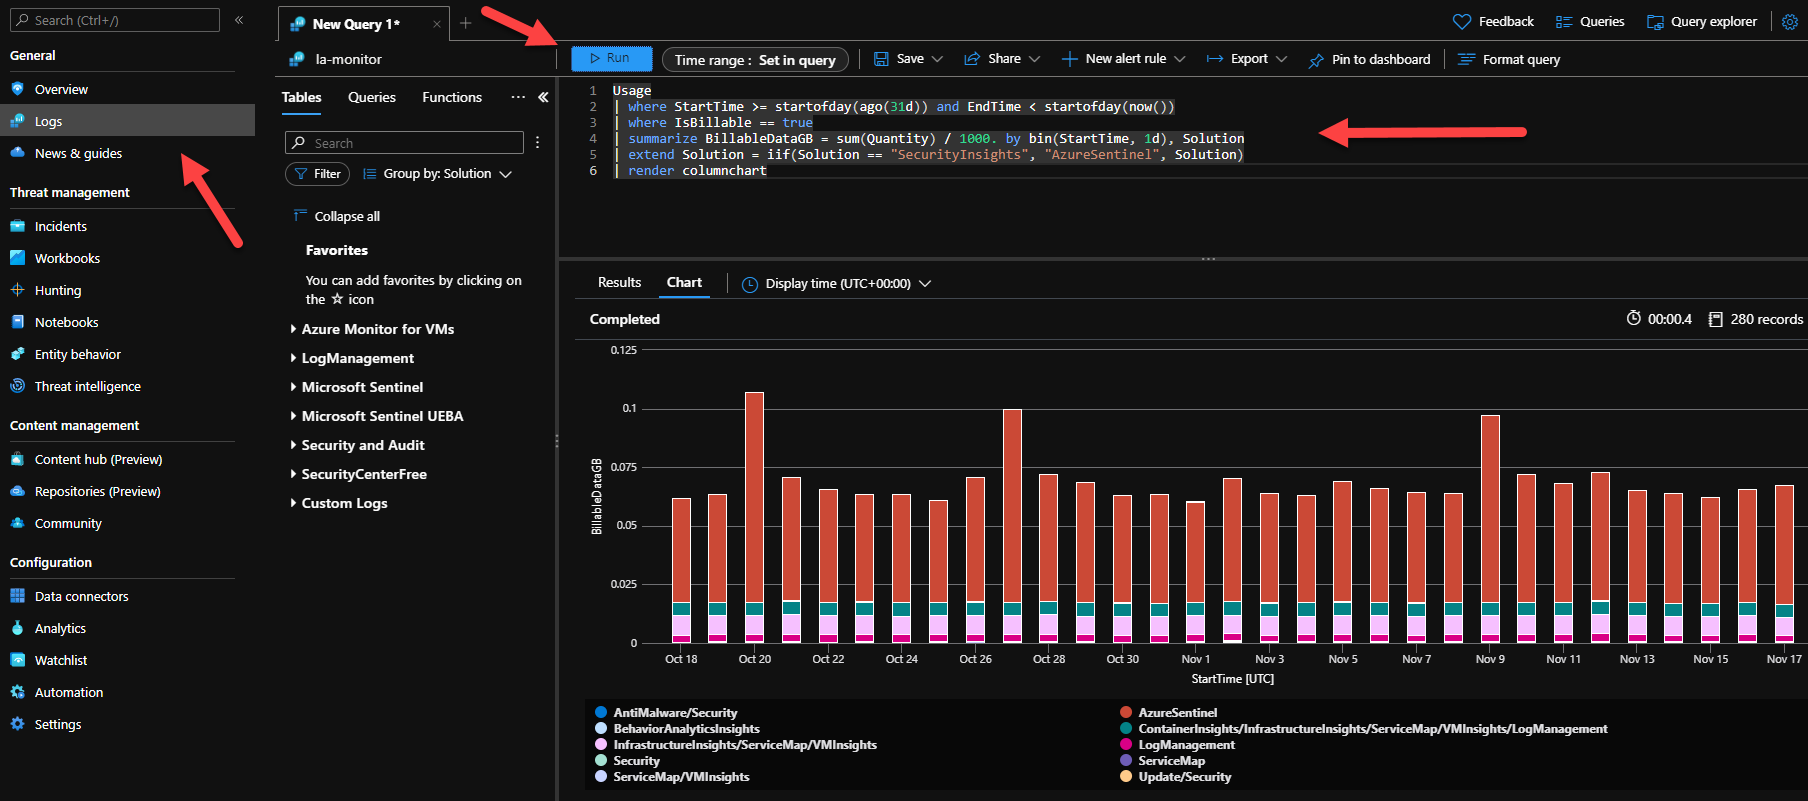
Run the following query to show data ingestion volume by solution. In this case, it is the SecurityInsights and AzureSentinel logs for the last 31 days:
Usage
| where StartTime >= startofday(ago(31d)) and EndTime < startofday(now())
| where IsBillable == true
| summarize BillableDataGB = sum(Quantity) / 1000. by bin(StartTime, 1d), Solution
| extend Solution = iif(Solution == "SecurityInsights", "AzureSentinel", Solution)
| render columnchart
Here is what the results look like in my environment.
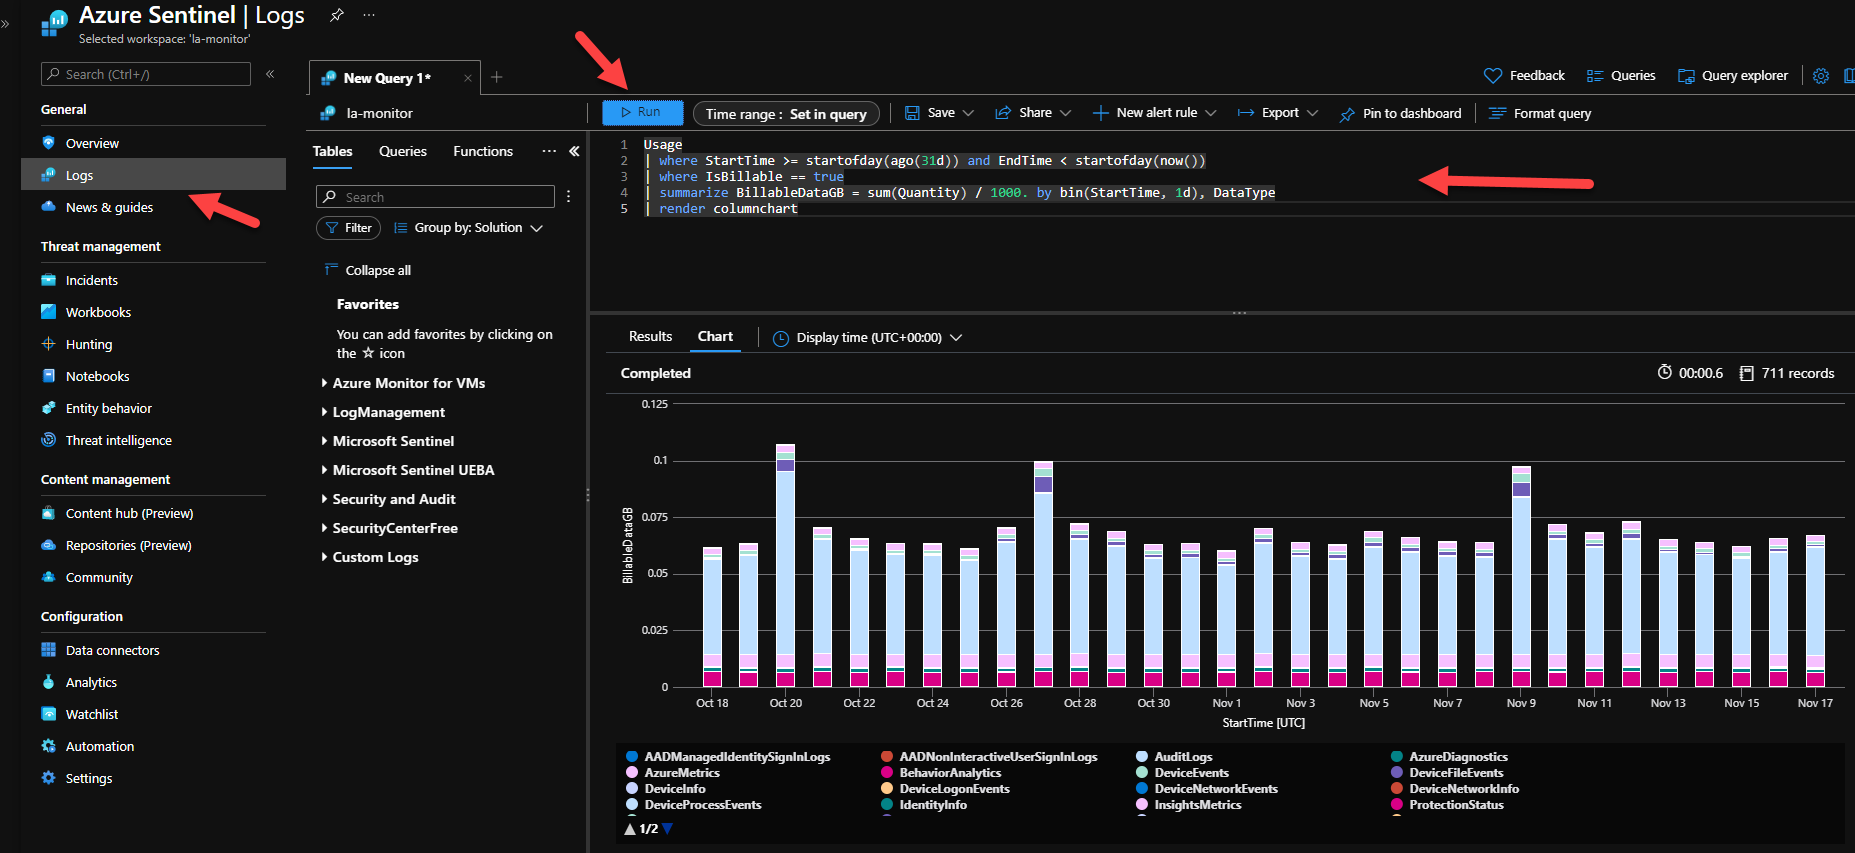
Run the following query to show data ingestion volume by data type:
Usage
| where StartTime >= startofday(ago(31d)) and EndTime < startofday(now())
| where IsBillable == true
| summarize BillableDataGB = sum(Quantity) / 1000. by bin(StartTime, 1d), DataType
| render columnchart
Here is what the results look like in my environment.
Run the following query to show data ingestion volume by both solution and data type:
Usage
| where TimeGenerated > ago(32d)
| where StartTime >= startofday(ago(31d)) and EndTime < startofday(now())
| where IsBillable == true
| summarize BillableDataGB = sum(Quantity) by Solution, DataType
| extend Solution = iif(Solution == "SecurityInsights", "AzureSentinel", Solution)
| sort by Solution asc, DataType asc
Here is what the results look like in my environment.
Everything I have discussed here is available on the Microsoft Docs website. Please check out the following links: